Monohybrid Inheritance
- Monohybrid inheritance is the inheritance of characteristics controlled by a single gene
- It can be investigated using a genetic diagram known as a Punnett square
- A Punnett square diagram shows the possible combinations of alleles that could be produced in the offspring
- From this, the ratio of these combinations can be worked out
- Remember the dominant allele is shown using a capital letter and the recessive allele is shown using the same letter but lower case
Pea plants
- Pea plants were used by the scientist Mendel to investigate monohybrid inheritance
- The height of pea plants is controlled by a single gene that has two alleles: tall and short
- The tall allele is dominant and is shown as T
- The small allele is recessive and is shown as t
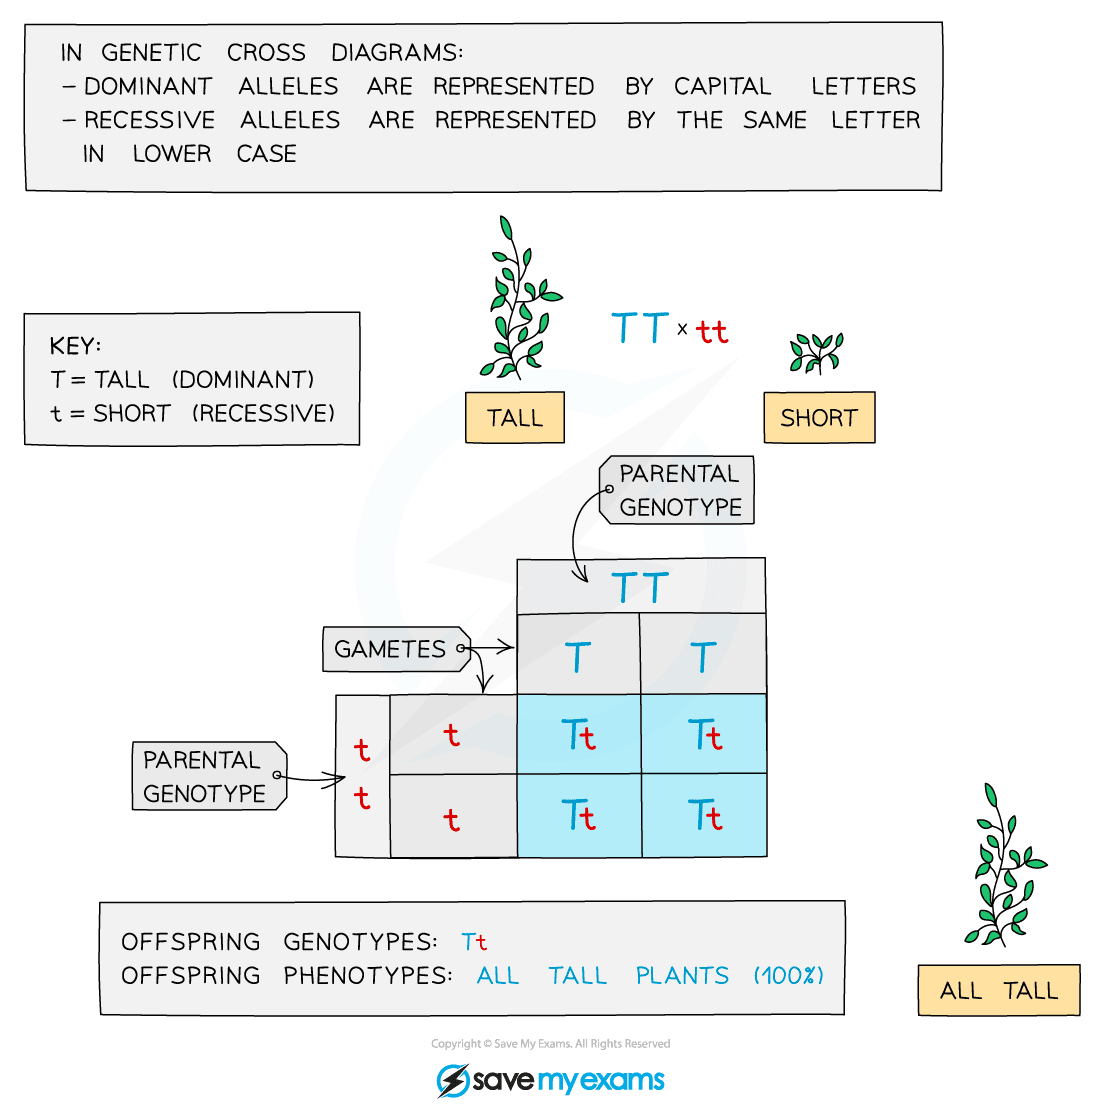
A pure breeding short plant is bred with a pure breeding tall plant
- The term ‘pure breeding’ indicates that the individual is homozygous for that characteristic
A pure-breeding genetic cross in pea plants. It shows that all offspring will have the tall phenotype.
Crossing the offspring from the first cross
A genetic cross diagram (F2 generation). It shows a ratio of 3 tall : 1 short for any offspring.
- All of the offspring of the first cross have the same genotype, Tt (heterozygous), so the possible combinations of offspring bred from these are: TT (tall), Tt (tall), tt (short)
- There is more variation in the second cross, with a 3:1 ratio of tall : short
- The F2 generation is produced when the offspring of the F1 generation (pure-breeding parents) are allowed to interbreed
Crossing a heterozygous plant with a short plant
- The heterozygous plant will be tall with the genotype Tt
- The short plant is showing the recessive phenotype and so must be homozygous recessive – tt
- The results of this cross are as follows:
A cross between a heterozygous plant with a short plant
How to construct Punnett squares
- Determine the parental genotypes
- Select a letter that has a clearly different lower case, for example, Aa, Bb, Dd
- Split the alleles for each parent and add them to the Punnett square around the outside
- Fill in the middle four squares of the Punnett square to work out the possible genetic combinations in the offspring
- You may be asked to comment on the ratio of different allele combinations in the offspring, calculate percentage chances of offspring showing a specific characteristic or to determine the phenotypes of the offspring
- Completing a Punnett square allows you to predict the probability of different outcomes from monohybrid crosses
Calculating probabilities from Punnett squares
- A Punnett square diagram shows the possible combinations of alleles that could be produced in the offspring
- From this, the ratio of these combinations can be worked out
- However, you can also make predictions of the offsprings’ characteristics by calculating the probabilities of the different phenotypes that could occur
- For example, in the second genetic cross (F2 generation) that was given earlier (see above), two plants with the genotype Tt (heterozygous) were bred together
- The possible combinations of offspring bred from these two parent plants are: TT (tall), Tt (tall), tt (short
- The offspring penotypes showed a 3:1 ratio of tall : short
- Using this ratio, we can calculate the probabilities of the offspring phenotypes
- The probability of an offspring being tall is 75%
- The probability of an offspring being short is 25%
Exam Tip
If you are asked to use your own letters to represent the alleles in a Punnett square, try to choose a letter that is obviously different as a capital than the lower case so the examiner is not left in any doubt as to which is dominant and which is recessive.
Family Pedigrees
- Family pedigree diagrams are usually used to trace the pattern of inheritance of a specific characteristic (usually a disease) through generations of a family
- This can be used to work out the probability that someone in the family will inherit the genetic disorder
A family pedigree chart
- Males are indicated by the square shape and females are represented by circles
- Affected individuals are red and unaffected are blue
- Horizontal lines between males and females show that they have produced children (which are shown underneath each couple)
- The family pedigree above shows:
- Both males and females are affected
- Every generation has affected individuals
- That there is one family group that has no affected parents or children
- The other two families have one affected parent and affected children as well


