Distance-Time Graphs: Basics
- A distance-time graph shows how the distance of an object (from a point) varies over time:

Graphs showing how the distances travelled by three objects vary over time
- A horizontal line means stationary
- A straight line means constant speed
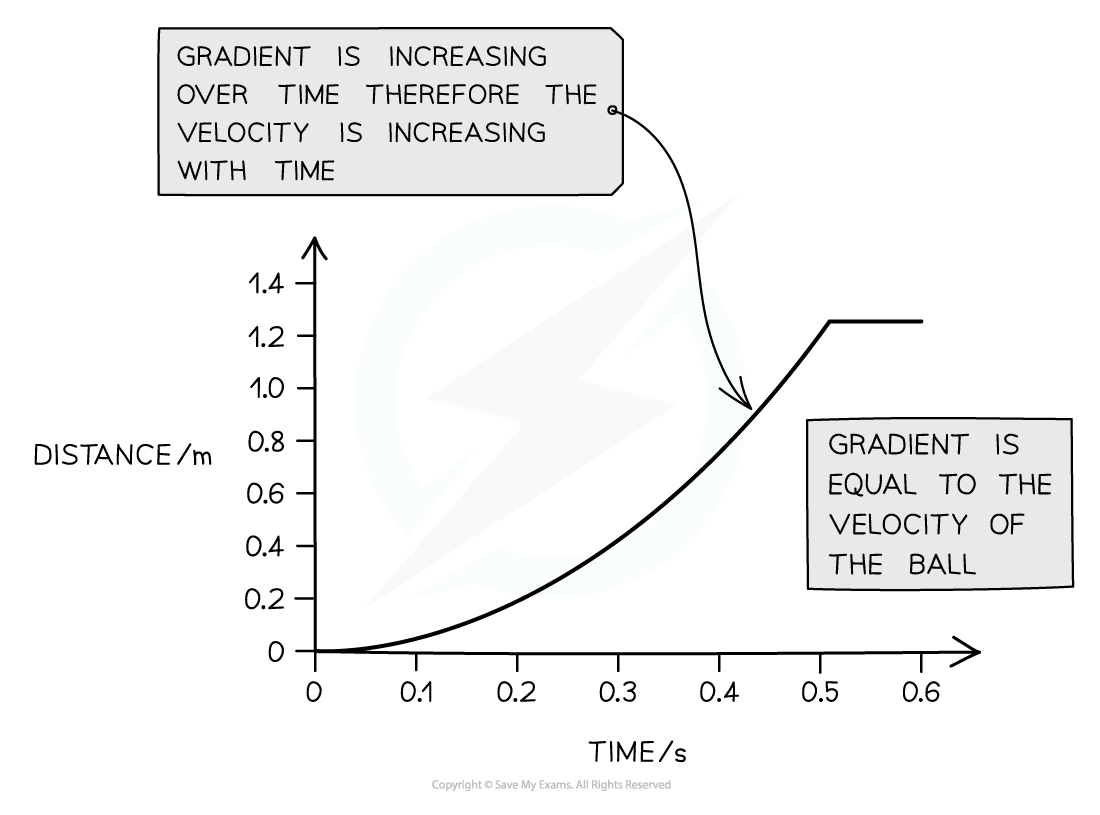
- If the gradient increases the object is speeding up (accelerating)
- If the gradient decreases the object is slowing down (decelerating)
- If the line is going down, the object is moving backwards
https://player.vimeo.com/video/363999375?title=0&byline=0&portrait=0Extended Only
Calculating Speed
- The speed of an object is given by the gradient of the line

Exam Tip
When you come across any graph, look carefully at what is plotted on each axis and think for a while about what the graph is showing you.
Distance-time graphs are also known as position-time graphs or displacement-time graphs. Don’t be fooled by these different names: they describe the same kind of things.
